The Invisible Structure of the Global Economy
Every company depends on others. Components, logistics, energy, distribution, and revenue are all shaped by relationships that sit outside the four walls of a single balance sheet.
Traditional analysis treats companies as if they operate alone. Reality does not. The market moves through relationships. That layer has been hard to measure. RedGraphs was built to make these connections visible and quantifiable.
Why Now
The economy is more connected and more fragile than at any time in recent memory. Supply shocks move through industries in weeks. Policy changes ripple across regions overnight.
Conventional datasets explain what happened. They rarely explain how it spread. To manage risk and find alpha, investors need to understand structure, not only outcomes. This is the role of business relationship intelligence.
Innovation: Mathematics That Reveals the Invisible
At the core of RedGraphs is a rigorous inference engine that estimates hidden transaction values between companies. We use Iterative Proportional Fitting and Bayesian optimization to infer missing flows while keeping results consistent with audited financial statements.
Each estimate is anchored in S&P Global financial data. Totals across revenue, cost, segment, and region remain balanced. The result is a complete and financially coherent map of value movement even when most transactions are not disclosed.
In practical terms, we do not stop at who is connected. We measure how much the connection matters.
From Text to Structure
RedGraphs fuses sophisticated transformer models and large language systems to read filings, earnings transcripts, contracts, and regulatory reports at scale. The models identify supplier and customer relationships, validate these against financials, and pass them to probabilistic models that assign direction and strength.
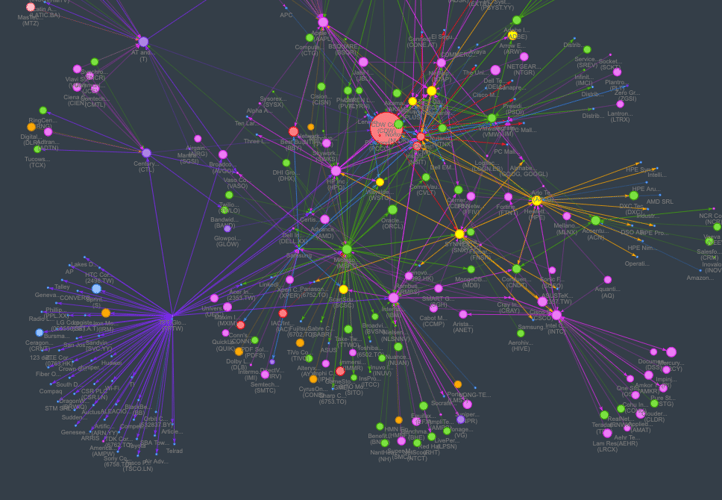
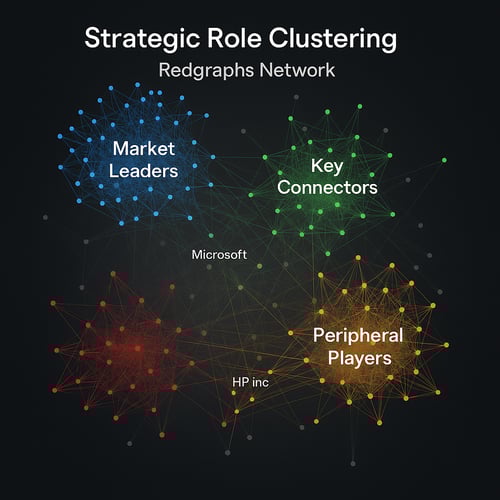
This creates a living, directed graph of corporate interdependence. Across this network we compute centrality, dependency, and contagion metrics on more than two million relationships. These measures reveal influence, exposure, and fragility that a spreadsheet cannot show.
What Makes This Different
Most supply chain datasets describe relationships without quantifying their financial weight. Many stop at tier one. Few link to audited statements in a way that supports risk modeling and alpha research.
RedGraphs delivers a quantitative and continuously updated economic graph. It is grounded in verified financials, enriched by AI, and balanced by mathematics. It is not a list. It is infrastructure.
| Legacy Approach |
RedGraphs |
| Flat lists of suppliers and customers |
Weighted and multi tier economic graph |
| Static and descriptive |
Dynamic, inferred, and predictive |
| Separate from financials |
Integrated with audited S&P data |
| Updated infrequently |
Continuously refreshed with AI and probabilistic inference |
What This Means for Investors
When relationships become measurable, they become actionable. Risk teams can find fragile clusters before they appear in earnings. Portfolio managers can trace exposure through indirect suppliers and customers. Quant researchers can model contagion, influence, and dependency as new sources of alpha.
- Detect fragility clusters early
- Quantify supplier and customer dependency across portfolios
- Build relationship based factors for alpha generation
- Simulate contagion paths under market shocks
- Measure revenue exposure by counterparty and region
A Personal View
I have spent years piecing together supply networks, linking entity mentions across documents, and guessing at flow magnitudes. It felt like modeling the ocean by measuring raindrops.
With a complete and financially balanced relationship graph, we can see the market as a connected system. We can measure how stress propagates, how influence concentrates, and where dependency builds quietly over time. This is the infrastructure I always wanted as a data driven investor.
A New Standard for Relationship Intelligence
RedGraphs bridges financial truth and economic structure. Mathematics and AI turn hidden connections into measurable value. This is how we move from isolated entities to connected intelligence and how we convert structure into signal.
RedGraphs. Mathematics for estimating the unknown. Infrastructure for business relationship intelligence.
Learn More
If you would like to see the graph in action or discuss portfolio use cases, reach out to our team. We are happy to share examples and results.